Globally Harmonized Geostationary Infrared Analysis
No single geostationary satellite sees the whole Earth. WeatherDreamer uses a unified embedding approach to stitch GOES-19 and GOES-18, METEOSAT, and GEO-KOMPSAT-2A data into one seamless, continuously updated global grid.
From 36,000 kilometers above the equator, geostationary satellites provide continuous observations of high-impact weather phenomena that are often poorly represented in models: atmospheric rivers, volcanic plumes, mesoscale convective systems, and extratropical cyclones. Today, the global constellation of operational geostationary imagers provides the highest resolution, most continuous record of the global atmospheric state available from any observing system.
But these international satellites weren't built to agree with each other. Differences in spectral response functions, radiometric calibration, scan geometry, and viewing angle introduce systematic biases that complicate creating consistent global composites. NCEP's MergeIR solved harmonization for a single infrared channel and became the backbone of global precipitation research for decades.
Our globally harmonized, multispectral brightness temperature product is what comes next. The model ingests GOES-19, GOES-18, METEOSAT, and GEO-KOMPSAT-2A infrared observations into a shared latent representation. Learned intercalibration combines the datasets into a single, consistent global grid.
- Horizontal Resolution: 0.1° (~10 km) global grid
- Spatial Coverage: Continuous global span to +/- 81 degrees latitude
- Temporal Resolution: Updated hourly with a latency of 45 minutes
- Delivery Format: Cloud-native data cubes on Arraylake, built for Python, Xarray, and PyTorch streaming
The data is available on Earthmover's Arraylake Marketplace as an hourly updating real time feed, and as a free sample dataset available instantly:
Architecture
Zeus AI's world model ingests brightness temperature measurements from the instruments aboard GOES-19 and GOES-18, METEOSAT, and GEO-KOMPSAT-2A and treats each satellite's spectral footprint as a distinct modality, implicitly learning inter-satellite calibration from spatial overlaps. Rather than fitting a single window channel, the model captures the full vertical and spectral structure of the atmosphere across the Advanced Baseline Imager (ABI) infrared spectrum (3.9 µm to 13 µm). The result is a single global grid with consistent channels that no individual satellite provides.
Rather than relying on frame-by-frame processing, the core architecture adapts the Dreamer family of world models, originally pioneered in deep reinforcement learning, for global geophysical observations. The system operates as a recurrent state-space model that maintains an internal, compressed latent representation of the global atmospheric state that is evolved continuously over time by leveraging learned dynamics. This state-space approach addresses the inherent vulnerabilities of operational geostationary streams, including:
- Routine satellite maneuvers and limb adjustments
- Ground network telecommunication drops
- Instrument anomalies and calibration outages
Where observations are absent or delayed, the model propagates its internal state forward, producing physically plausible output rather than freezing or interpolating across gaps. This ensures an uninterrupted, operationally dependable data pipeline for downstream AI models and real-time decision frameworks.
Validation
Zeus AI's global IR analysis is consistent with NOAA's merged IR records and raw geostationary sensor observations across the entire infrared spectrum.
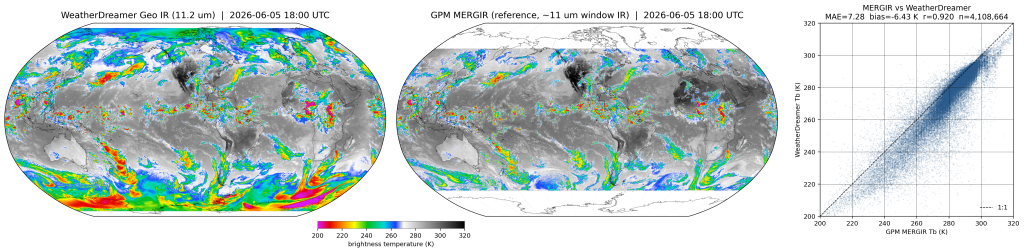
Comparison to GPM MERGIR.
We compared Zeus AI's global brightness temperatures to NCEP's 4km Global Merged IR V1 (MERGIR). MERGIR provides half-hourly coverage (60S to 60N) dating back to 1998 but has a 24-hour real-time processing delay and is limited to a single common wavelength (~11 µm).
Comparing our global reconstruction of GOES ABI Band 14 (11.2 µm) against MERGIR yields a correlation of R = 0.92 and a Mean Absolute Error (MAE) of 7.28 K at a representative time step. Observed deviations are primarily driven by a known systematic cold offset between the datasets, spectral and inter-sensor variations, grid/time resampling, and limb-geometry effects.
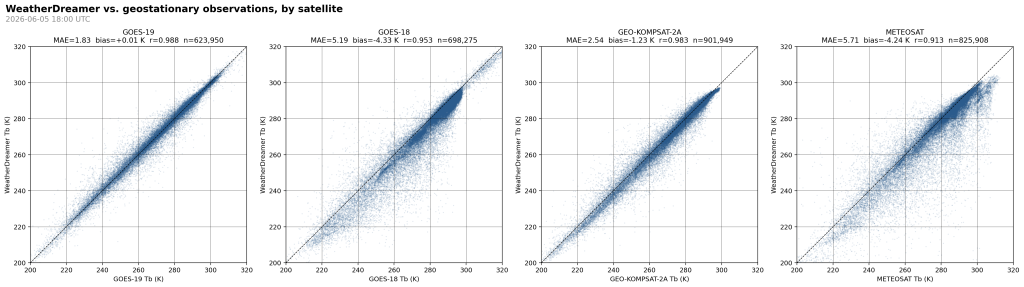
Direct comparison to geostationary observations.
To evaluate real-time accuracy, pixelwise comparisons were conducted between the Zeus AI merged grid and raw imagery from GOES-19, GOES-18, METEOSAT, and GEO-KOMPSAT-2A. To remove limb-darkened pixels from the evaluation, analysis was constrained to sub-70 degrees nadir pixels.
The data reveals strong reconstruction compared to raw observations:
- GOES-19: Correlation of R = 0.99 | Bias of +0.0 K
- GEO-KOMPSAT-2A: Correlation of R = 0.98 | Bias of -1.2
- GOES-18 & METEOSAT: Correlations (R = 0.95 and 0.91, respectively) with a minor ~ 4 K cold bias, which accounts for the bulk of the cold offset observed in the MERGIR benchmarks
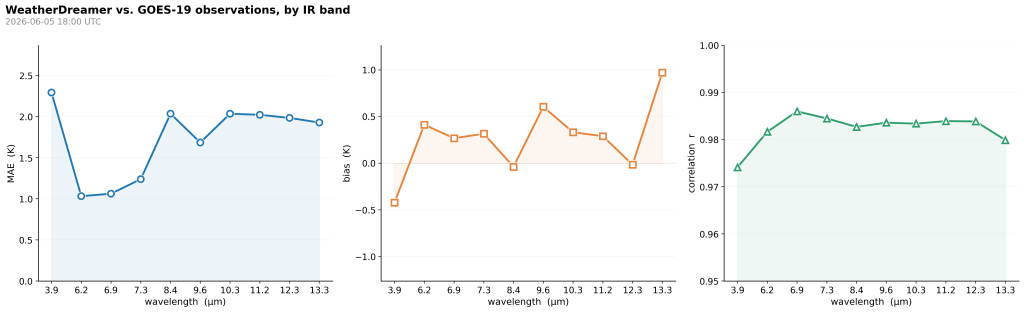
Evaluation by band.
Because the world model reconstructs the full ABI infrared spectrum rather than fitting a single window channel, we isolated and evaluated each of GOES-19's ten IR bands (3.9-13.3 µm) individually:
- Uniform Precision: Correlation coefficients remain consistently high, between 0.97 and 0.99 across all ten bands.
- Minimal Error: ranging from ~1.0 K in the water-vapour bands (6.2-7.3 µm) to ~2 K in the other bands. Biases across the majority of the spectrum fall strictly within ±0.5 K, showing that the architecture successfully reproduces the vertical and spectral structure of the imagery.
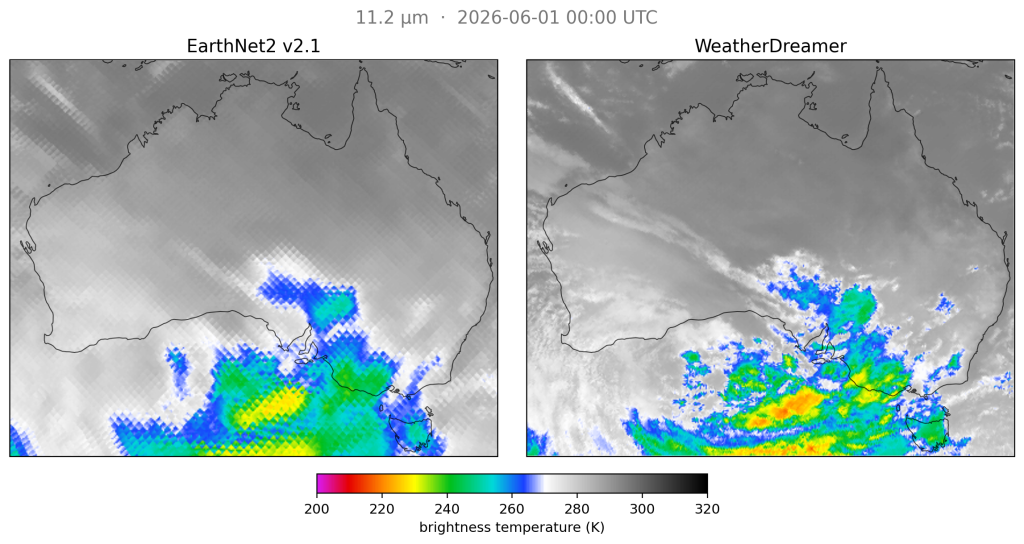
Comparison to EarthNet V2.
Finally, we benchmarked WeatherDreamer against Zeus AI's first-generation multimodal foundation model, EarthNet. The two models exhibit general agreement, with an MAE of 5.0 K, <0.1 K bias, and a correlation of R = 0.94. However, at localized regional scales, WeatherDreamer resolves markedly finer spatial structures and generates visually cleaner fields free of tile boundary artifacts. The comparison confirms that the current generation preserves EarthNet's large-scale fidelity while dramatically sharpening local detail.
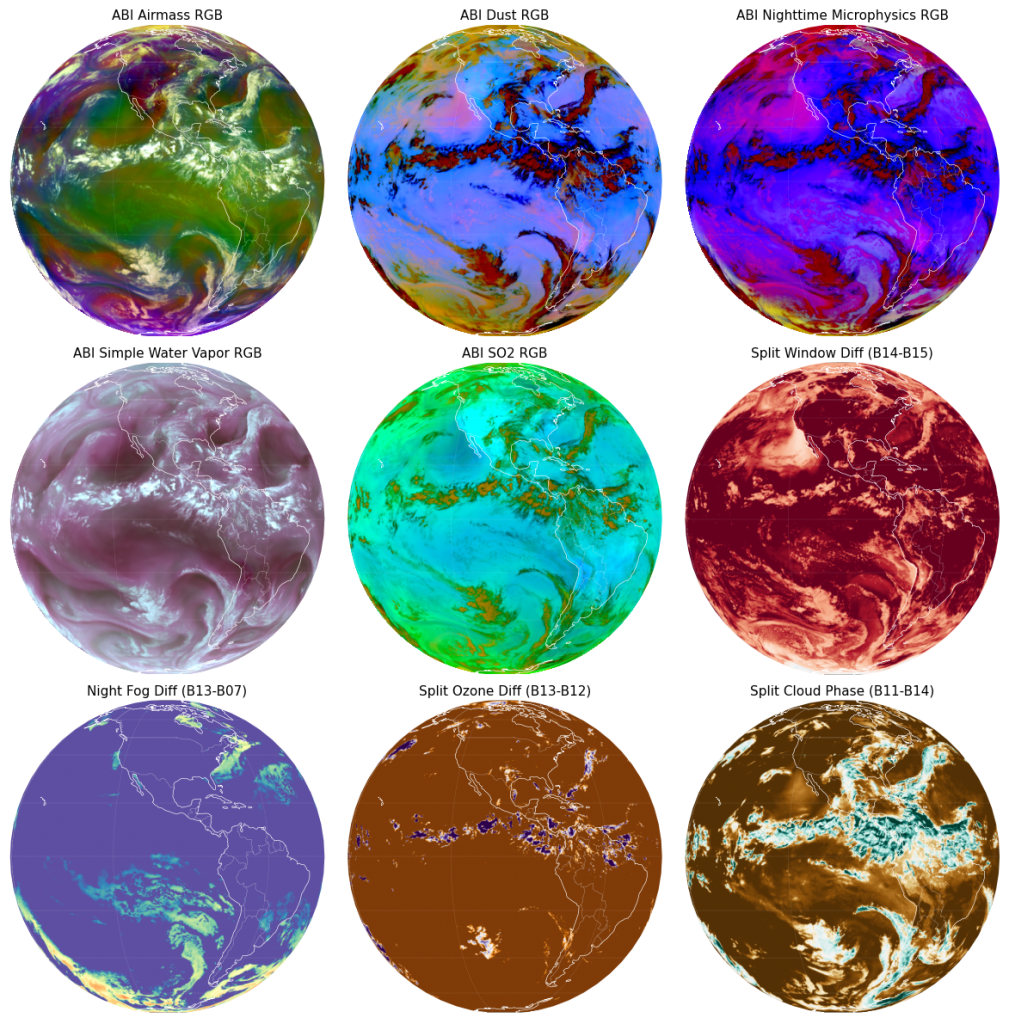
Ten bands, dozens of observables
The analysis unifies ten Advanced Baseline Imager (ABI) infrared channels into a single grid. Spanning from the shortwave window (3.9 µm) through the CO2 absorption band (13.3 µm), these channels capture distinct atmospheric features:
- Tropospheric Water Vapor: Sensitivity across the lower, mid, and upper troposphere
- Cloud Dynamics: Microphysical profiling of cloud-top temperatures, convective heights, and cloud thermodynamic phase changes (liquid vs. ice)
- Boundary & Surface Activity: High-frequency monitoring of surface emissions, total column ozone loading, and aerosol/dust concentrations
Because the underlying brightness temperatures are perfectly harmonized across all international sensors, users can instantly calculate a family of multi-channel composite products without regional calibration errors, including airmass and moisture tracking, environmental and aviation hazards, and fog discriminators.
Data availability
The analysis product is observation-based and constitutes a continuous, calibration-consistent record of the observed atmospheric state at hourly intervals. The dataset is available in cloud-native format via Arraylake and is suitable for direct ingestion into machine learning training pipelines, validation frameworks, and operational monitoring workflows.
Access the data with a Colab Notebook
Extension to visible and near-infrared channels, increased spatial and temporal resolution, and short-range brightness temperature forecasting are under active development. Input on prioritization is welcomed: Let us know what you would like to see next!